Collect Earth Online can now easily connect to the Dynamic World dataset as basemap imagery and as a Geo-Dash widget. Dynamic World enables CEO users to track land-use change at speeds that conventional land-cover products cannot match.
Dynamic World is a near–real-time global land-cover dataset developed jointly by Google and World Resources Institute (WRI). It uses deep learning applied to Sentinel-2 imagery to produce 10-meter resolution land-cover maps that update every 2–5 days, depending on location.

Integrating Dynamic World into Collect Earth Online can support data interpretation by adding consistency and analytical depth to land-cover interpretation.
Dynamic World data does not replace human interpretation—but it accelerates and strengthens it.
Collect Earth Online now has Dynamic World available as platform imagery for use by all CEO users. Leveraging Google Earth Engine, CEO accesses the Dynamic World V1 dataset directly.
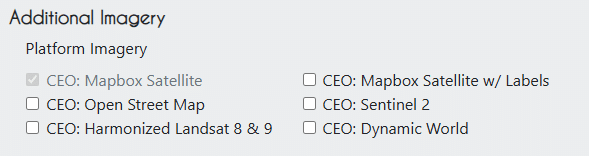
There are two ways Administrators can add Dynamic World as basemap imagery. First, there is a default Dynamic World Platform Imagery option that can be added to any project during Imagery Selection.
Second, you can add a more customized Dynamic World imagery to your Institutional Imagery. For this option, simply go to your Institution’s Page and select the Imagery tab. Click Add Imagery, then select Dynamic World as the option.
You can select a start and end date. The earliest start date possible is 2015-06-27 (June 27, 2015). The latest start date is the current day.
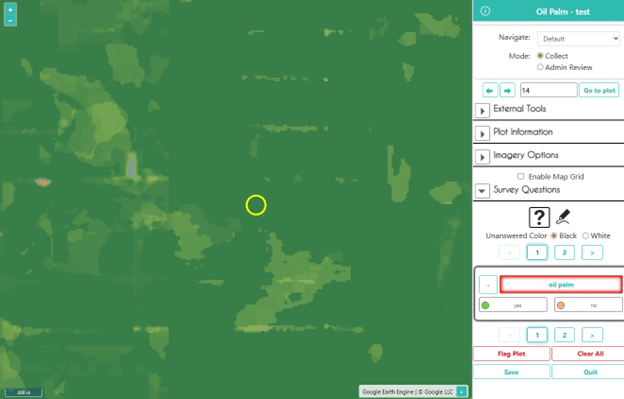
Using the visualization parameters, you can show the most likely class for each pixel (the “label” band) or the probability of any specific class using that class’ band.
Here’s one example for the label band:
{
"bands": ["label"],
"min": 0,
"max": 8,
"palette": ["419bdf", "397d49", "88b053", "7a87c6", "e49635", "dfc35a", "c4281b", "a59b8f", "b39fe1"]
}
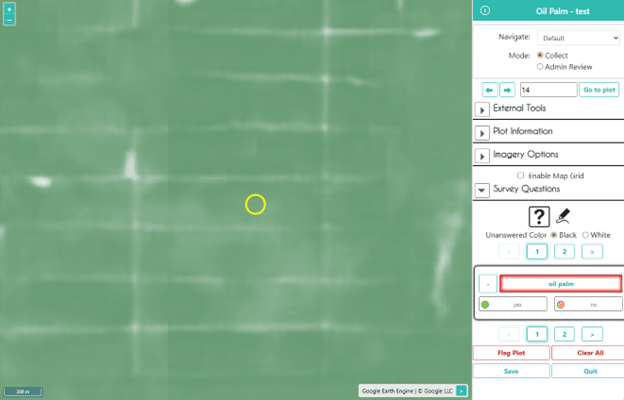
And one to show the probability of trees:
{
"bands": ["trees"],
"min": 0,
"max": 1,
"palette": ["ffffff", "397d49"]
}
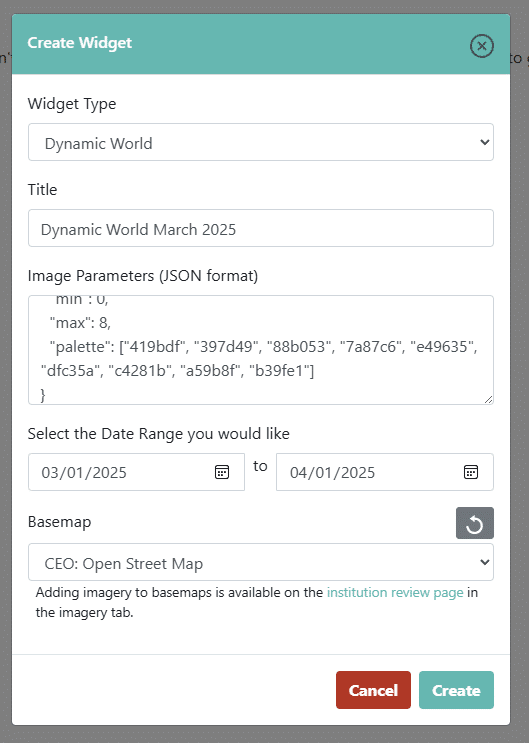
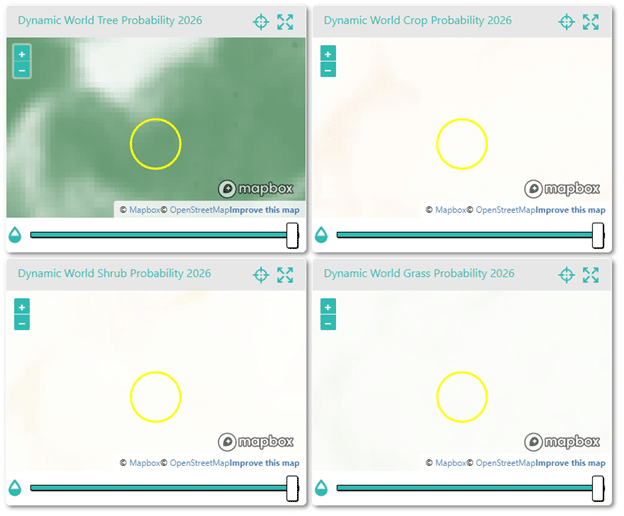
Collect Earth Online also makes it easy to create a Dynamic World widget in the Geo-Dash. The new Dynamic World widget allows for easy integration of Dynamic World’s land cover classification into your workflow.
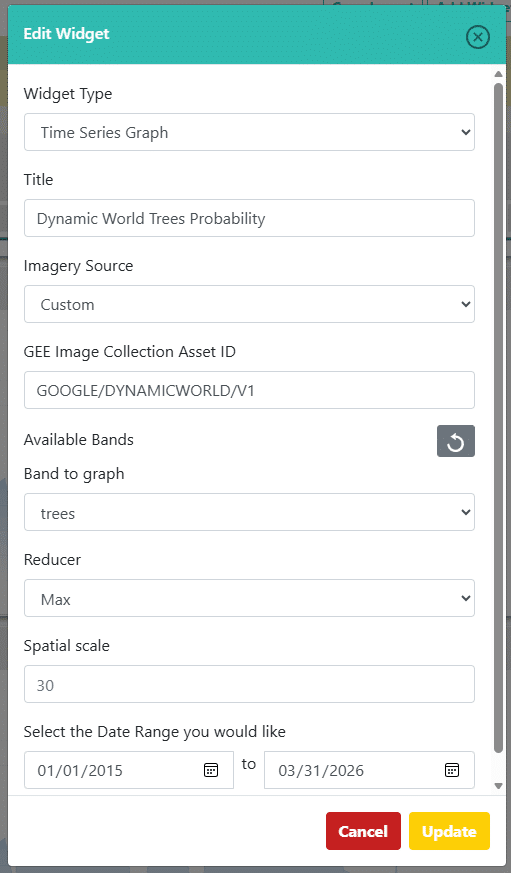
To set up the widget, simply add a Title, select the Date Range, and add your Image Parameters as you did with the Imagery.
Using multiple widgets allows you to set up side by side comparisons for different time periods or land cover classification probabilities.
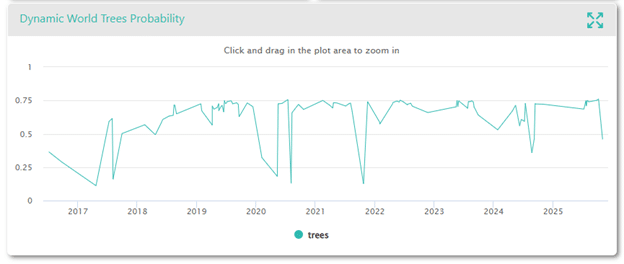
You can also use the Time Series widget to add custom time series graphs, plotting the probability of any one land cover class from 0 to 1 or the most likely land cover class with the “labels” band (represented by their numerical label).
Tree probability graphed over time:
Label (most likely class) plotted over time:
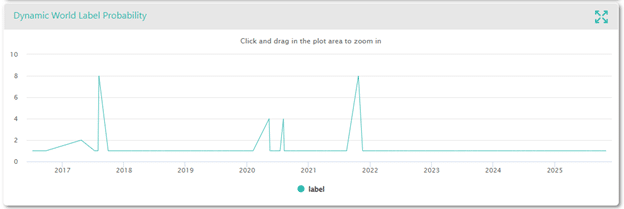
Using the label band, we can see that the plot is mostly classified as 1 (trees) but occasionally as 2 (grass), 4 (crops) or 8 (snow and ice), likely due to cloud cover.
Integrating Dynamic World into Collect Earth Online can strengthen both data quality and workflow efficiency. We hope this new feature is useful to you.