For organizations working at the intersection of climate science and forest monitoring, the challenge isn’t just mapping change, it’s validating it with confidence. For the team at CTrees, Collect Earth Online (CEO) has become an essential tool for doing exactly that. By enabling large-scale, collaborative interpretation of satellite imagery, CEO supports the generation of high-quality reference data used in REDD+ reporting, jurisdictional assessments, and scientific research. Its flexibility and scalability have made it a key part of CTrees’ operational pipeline.
CTrees is a nonprofit organization that provides science-based forest activity and carbon data to support climate policy and finance, with a focus on tracking deforestation, degradation, regrowth, and restoration (www.ctrees.org). It brings together experts in carbon and climate science, remote sensing, tropical forest ecology, AI, and data science to help governments, companies, and other organizations better measure and protect forests.
In CTrees’ pipelines, deforestation and forest degradation maps are created using satellite imagery together with AI methods. However, high-quality reference data to validate maps and generate area estimates with uncertainty are also key for REDD+ methodologies and reports following good practices that are standard in the scientific community (Olofsson et al., 2014). CEO has become one of our most important tools for that work. Since 2022, we have used the platform across more than 300 projects and over 150,000 interpreted samples, supporting REDD+ analyses, jurisdictional assessments, and scientific studies on forest disturbance mapping (Figure 1).
In our opinion, one of CEO’s biggest strengths is that it allows us to view multiple imagery sources together in a single interpretation environment. Rather than relying on one sensor or one date, we operationally visualize and compare Landsat, Sentinel-2, and Planet NICFI imagery across time to better identify deforestation and degradation. This makes it easy to understand the land cover patterns over time and separate repeated seasonal change from disturbances, which is difficult without the additional temporal context. The use of multiple sensors is especially valuable for identifying disturbances that may be visible in one dataset or date but much less clear in another, depending on timing, spatial resolution, image quality, and recovery.
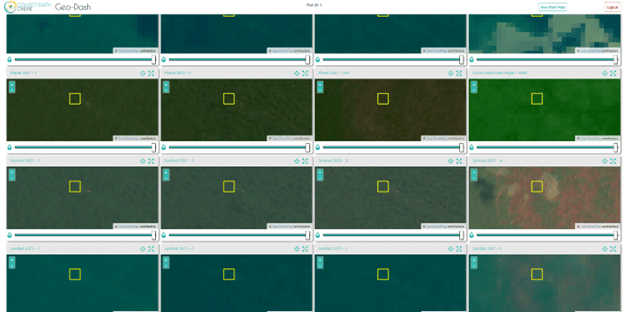
For example, a forest fire in Mato Grosso at the end of 2021 was clearly visible across Planet, Sentinel, and Landsat imagery (Figure 2). By 2022 the evidence had already become much less obvious, especially in Landsat (not shown). CEO makes it much easier to compare those datasets side by side and improve confidence in sample interpretation. Our dashboard includes imagery from each trimester of the year to increase our chances of visually identifying fire degradation, which can quickly occur and disappear from images.
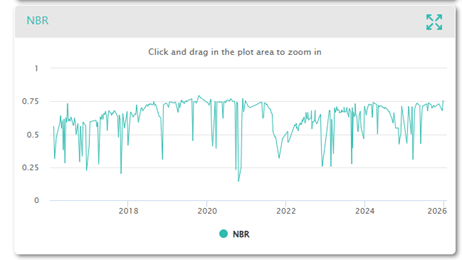
We also combine imagery interpretation with other sources of evidence. One example is the use of NBR (Normalized Burn Ratio) time series to help identify burned areas (Figure 3). Even when a satellite image mosaic does not capture the fire at the ideal date, the NBR signal can show a clear drop associated with burning and help confirm the disturbance (see the anomalous and persistent drop in signal at the end of 2021). We also use supporting layers such as GLAD land cover, canopy height, and very high-resolution imagery, which are especially useful for distinguishing forests from non-forests, plantations, and other land cover types.
By hosting all of our reference data collection on CEO, we have been able to scale up our work tremendously. Not only does the platform keep our work organized by having the data readily available in one place, with projects easily updated as-needed, but it ensures consistency in our data collection protocols both between interpreters and between different projects.
A key advantage of CEO is that it supports overlapping interpretation between multiple analysts all done in real time in the cloud. In our workflows, we consistently have three interpreters analyzing the samples, but we have used up to 10 interpreters for the same project. CEO ensures this simultaneous collection is completed without duplicate work and in a standardized manner with all interpreters having access to the same imagery and using a pre-defined survey to record responses. We are then easily able to track interpreters’ progress through the CEO’s project dashboard.
Also, we always consider 10% of samples to be reviewed by three different interpreters so we can measure agreement, identify uncertain cases, and improve interpretation protocols. CEO handles the creation of these 10% random samples and distributes them across interpreters. This is particularly important in more challenging environments, such as seasonally flooded areas or plantation landscapes, where visual interpretation can be less straightforward. Samples with higher uncertainty can then be reviewed by senior analysts and their interpretation aligned with the team.
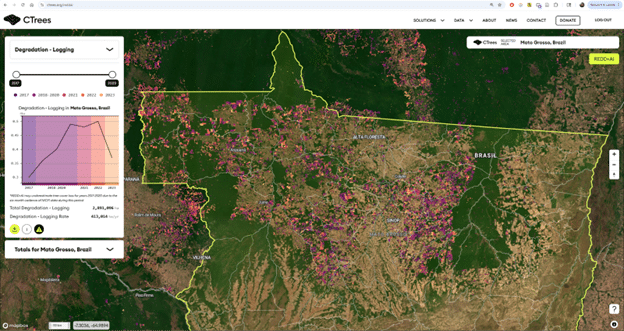
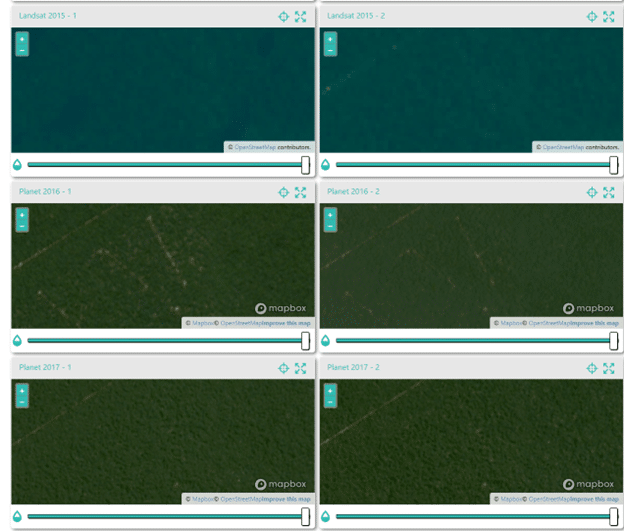
CEO has supported several major applications at CTrees. It was used to collect reference samples for deforestation estimates in more than 15 countries under Verra’s VM0048 framework and supported assessments for jurisdictional REDD+ with consistency in imagery being used for assessments and surveys being collected and managed all in the cloud. It has also been used to validate new methods to map tree cover loss and forest degradation due to logging and fire (Dalagnol et al., 2023; Wagner et al; 2023; Braga et al., 2025) with data available on CTrees REDD+AI platform (www.ctrees.org/reddai). The use of CEO in this context made it very easy to interpret the occurrence of selective logging through time to validate our maps presented in the REDD+AI platform (Figure 4). We also use CEO to validate land use change alerts that can correspond to deforestation or forest degradation (LUCA; www.ctrees.org/luca) (Mullissa et al. 2024).
Overall, Collect Earth Online has become a foundational part of our forest monitoring work. It helps us integrate multiple datasets, interpret change through time, coordinate across analysts, and support both operational projects and peer-reviewed research.
For readers interested in exploring the methodologies and applications behind this work, the following resources may be of interest: