CEO Collect Earth Online

Detecting Forest Degradation with CEO’s Geo-Dash

Detecting Forest Degradation with CEO’s Geo-Dash

Co-authors: Eric Bullock, Stephanie Spera, Yunuen Reygadas Langarica, and Raja Ram Aryal

Detecting forest degradation is emerging as a central issue in monitoring carbon emissions and forest ecosystem damage. In a recent peer-reviewed article in Global Change Biology, leading remote sensing expert Eric Bullock of Boston University and his team stated, “our results suggest that the area of disturbed forest in the Amazon is 44%–60% more than previously realized, indicating an unaccounted-for source of carbon emissions and pervasive damage to forest ecosystems”  (Bullock et al., 2020).

Users of Collect Earth Online (CEO) around the world are taking advantage of a CEO feature called the Geo-Dash Degradation Tool that allows them to monitor forest degradation, a major source of carbon emissions. CEO provides an intuitive, web-based data collection interface that enables multiple users to contribute to labeling the landscape, including for forest degradation monitoring purposes.

Video demonstrating detection of forest degradation using CEO’S Geo-Dash tool

CEO’s Geo-Dash Degradation Tool helps users confirm and verify cases of forest degradation, or temporary change in tree canopy cover. It does so by combining the Normalized Difference Fraction Index (NDFI) with a time series of Landsat and Sentinel imagery, allowing the user to detect changes in the forest canopy over time, even subtle and short-lived changes (Souza et al., 2005). The Degradation Tool leverages Google Earth Engine to make this information available to users.

❓What is forest degradation and why is it so hard to monitor?

There are many definitions of forest degradation, but most simply we think of it as a non-permanent change in tree canopy cover.

Forest degradation varies in severity, depending on the cause of the disturbance. Some degradation involves loss of all tree canopy and takes a considerable time to regrow, such as when trees are lost in forest fires. Others involve smaller changes after which the area quickly recovers, such as with selective logging. The defining characteristic is that the area eventually re-establishes intact forest cover. Deforestation, by contrast, refers to more permanent loss of forest canopy and conversion to other land uses such as agriculture.

Degradation is often detected in remote sensing by observing a temporary change in the level of greenness that is indicative of tree cover. This is often measured using an index that mathematically combines different parts of the light spectrum into a single value, such as NDFI. NDFI expresses what portion of a plot of land is covered by green vegetation as opposed to bare soil or non-photosynthetic (i.e., dead or dormant) vegetation. 

This illustration of NDFI as an aid to landscape interpretation (here, selective logging) shows intact forest as dark green, forest disturbance in orange-yellow, deforestation in magenta, and bare soil in white. Figure from Souza et al., 2005).
This illustration of NDFI as an aid to landscape interpretation (here, selective logging) shows intact forest as dark green, forest disturbance in orange-yellow, deforestation in magenta, and bare soil in white. Figure from Souza et al., 2005.

Detecting forest degradation can be difficult because the spatial scale is often small and the time when degradation is detectable using remote sensing imagery is short (usually within one year). It is also challenging in areas with persistent cloud cover.

That’s why it’s critical to have access to tools designed specifically to highlight the subtle signal of forest degradation in remotely sensed images.

The CEO Degradation Tool combines a time series plot of spectral indices such as NDFI along with an imagery viewing window, providing a user-friendly tool to aid in detecting forest degradation. By combining this index with a series of images, users can detect even relatively minor changes in vegetation and estimate when those changes occur.

Having a time series plot of spectral indices and images also helps avoid confusion between seasonal vegetation patterns and forest degradation. For example, you would expect deciduous forests to show a high proportion of non-photosynthetic vegetation in winter, after the leaves have fallen. If a similar signal appears during the summer, however, it more likely indicates forest degradation. Forests with rainy and dry seasons would show similar patterns, showing more non-photosynthetic vegetation, including burned forests, during the dry season. In contrast, in an evergreen forest with few seasonal vegetation patterns, a change in vegetation at any point of the year could indicate degradation.

🌐Leveraging the Degradation Tool

Multiple teams around the world, including in Nepal, LaoPDR, Peru, Afghanistan, and Bangladesh, are leveraging the Degradation Tool in CEO’s Geo-Dash to better understand the status of their forests and manage these same forests. This easy-to-use tool allows decision-makers to monitor degradation hotspots and understand how degradation is contributing to carbon emissions. It also allows them to track potential unintended consequences of sustainable development initiatives. 

Often, teams use the Degradation Tool in conjunction with the high-resolution time-stamped imagery from Planet available through Norway’s International Climate & Forests Initiative (NICFI) initiative. Users can leverage the high-resolution imagery to confirm when the disturbance occurred. 

High-resolution date-stamped imagery available from Planet through the NICFI initiative (A) helps users to confirm patterns of forest degradation seen using the Geo-Dash tool (B), which uses medium-resolution Landsat and Sentinel imagery. These images are from work in progress in Nepal.

🌲Nepal (SilvaCarbon, World Bank)

Researchers in Nepal are using the CEO Degradation Tool to inventory forest degradation and assess the associated greenhouse gas emissions. This work is part of an initiative to evaluate various approaches to monitoring, reporting, and verification (MRV) efforts in support of the World Bank’s Forest Carbon Partnership Facility (FCPF) payments.

Multiple approaches for mapping forest degradation using time-series algorithms are emerging. All of these approaches and resulting maps, however, contain errors, and some more than others. CEO’s Degradation Tool is helping Nepal identify which mapping process to invest in. The tool is also being used to create a complementary inventory at several plots to create an unbiased estimate of how prevalent these activities are across the landscape as part of the country’s reporting process.

Nepal is leveraging two key benefits of the Degradation Tool. First, the tool helps users to assess map quality and estimate uncertainty, producing unbiased area estimates of forest degradation and other impacts at a cost lower than that of field monitoring. Second, the tool provides an image archive allowing users to “re-see” the history of landscape changes. This is not possible to recreate in the field and allows users to assess whether the new time-series modeling approaches are accurately estimating the year when forest degradation occurred. In addition to the annual land cover maps of Nepal, CEO was also used to develop the Hindu Kush Himalayan Region Land Cover Monitoring System and National Land Cover Monitoring System in Nepal. CEO and the Degradation Tool were used to collect training sample data and validation data.

Forest degradation due to flooding detected by researchers in Nepal using the Geo-Dash Degradation Tool. (A) Prior to the flooding event in the area was forested as noted by the consistent high values of NDFI, (B) following the event seasonal patterns indicative of shrub and grassy vegetation are observed with gradually returning tree cover.
Forest degradation due to flooding detected by researchers in Nepal using the Geo-Dash Degradation Tool. (A) Prior to the flooding event, the area was forested, as noted by the consistent high values of NDFI. (B) Following the event, seasonal patterns indicative of shrub and grassy vegetation are observed, with gradually returning tree cover.

🌳Lao PDR (SilvaCarbon, F-REDD, World Bank)

Similar to the situation in Nepal, in early 2021 the Lao People’s Democratic Republic (Lao PDR) signed an Emissions Reduction Payment Agreement with the World Bank’s FCPF. As part of the ERPA implementation, Lao PDR is working to reduce the uncertainty of emission estimates due to shifting cultivation and selective logging.

While reducing uncertainty traditionally relied on field data collection, the Lao PDR team is testing the utility of time-series data algorithms for quantifying the changes in order to reduce costs, including the Forest Canopy Disturbance Monitoring (FCDM) maps (developed in collaboration with the European Commission’s Joint Research Center) and the Continuous Degradation Detection (CODED) algorithm. The Lao PDR team at the Forest Inventory and Planning Division works closely with the SilvaCarbon team to test and refine the CEO tool, which is now used to quantify the reduction in uncertainty by using these maps. Sample-based interpretation in CEO is also an excellent opportunity to involve other stakeholders, such as researchers from the Faculty of Forestry, in building common understanding of historical changes that occurred on the landscape.

Regarding CEO’s capability to support the Lao PDR’s efforts, Mr. Khamkhong of the Forest Inventory and Planning Department says, “First, CEO offers many types of imagery (Planetscope, Sentinel-1, Sentinel-2) for various time periods that enable us to understand the historical land cover change accurately. Secondly, the CEO interface and the inquiry form are well designed for users.”

Using CEO’s Degradation Tool provides the team with an inexpensive approach to collecting sample inventory to estimate the area of degradation and assess uncertainty. It also allows the team to identify when key degradation activities like logging are occurring.

Mr. Soukanh says, “CEO is really easy to use and provides reference information to conduct the interpretation with high accuracy. As the FIPD Deputy Director, I encourage my team to use this tool.”

An example of forest degradation due to shifting cultivation in LAO PDR detected by the CEO Degradation Tool. The degradation event occurred in early 2018, as indicated by a sharp decrease in NDFI, after which NDFI rose to previous levels.

🌴 Peru

In the Southwestern Amazon, University of Richmond professor Stephanie Spera’s Applied Sciences Team (AST) of the SERVIR Amazonia program is working to understand tradeoffs between forest cover and ecosystem services to help equip local and regional stakeholders with the information needed for sustainable development. The first step of this process is to map degradation across the region, including Ucuyali, Peru, and Acre, Brazil. Mapping degradation is especially difficult in this relatively remote region due to both persistent cloud cover and a lack of existing data. 

Spera and team are using CEO and the Degradation Tool to help determine which land cover algorithm best maps forest degradation across this transboundary region. CEO allows them to collect validation data to assess the accuracy of the algorithms so they can choose which one most accurately captures degradation in the southwestern Amazon. 

🌱How to set up the Degradation Tool

To add the Degradation Tool to your project, simply navigate to your Project Management page. Click on “Configure Geo-Dash,” then click on “Add Widget” and select “Degradation Tool.” Fill out the required fields, including Title, Band to Graph (we suggest NDFI), and the date range, and click “Create.” Resize the tool as needed after it has been added to the Geo-Dash. More detailed instructions can be found in the CEO manual hosted on the support page.

Adding the Degradation Tool to your project’s Geo-Dash is easy.

Our thanks to our ongoing funders: FAONASA-USAID SERVIR, and SilvaCarbon, a US government program. Thanks also to our technology partners: Norway’s International Climate & Forests Initiative for funding open high-resolution data availability, Planet for providing high-resolution imagery, and the Google Earth Engine team for creating a platform for Earth science data and analysis. 

Collect Earth Online is working constantly to improve the user experience, and your feedback is invaluable. If you have an idea, please let us know by writing to support@collect.earth. Thank you! 

For further reading, we suggest:

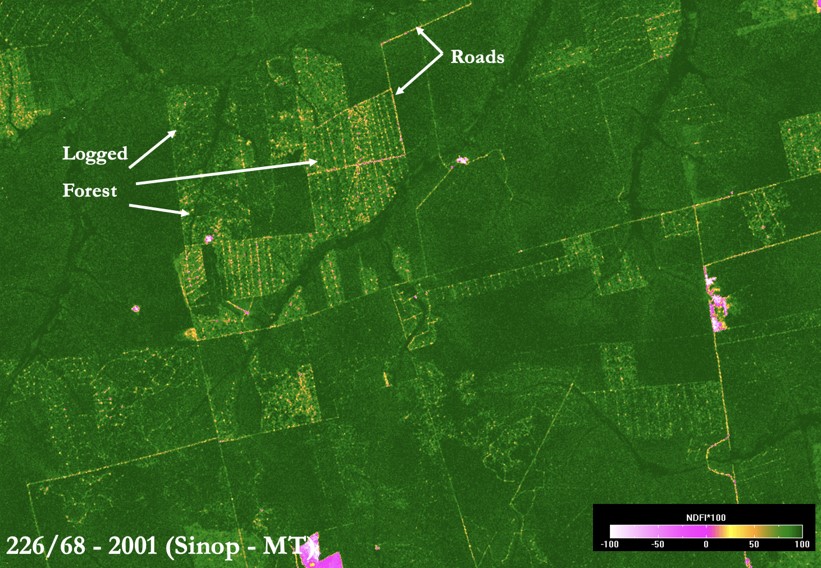
  • On NDFI: Souza Carlos M., J., Roberts, D. A. & Cochrane, M. A. (2005). Combining spectral and spatial information to map canopy damage from selective logging and forest fires. Remote Sens. Environ. 98, 329–343.). 
  • On forest disturbance in the Amazon: Bullock, E. L., Woodcock, C. E., Souza Jr, C., & Olofsson, P. (2020). Satellite‐based estimates reveal widespread forest degradation in the Amazon. Global change biology, 26(5), 2956-2969.