The Collect Earth Online team is excited to highlight a number of new features that we have launched, based on feedback from our community of users, to make it even easier for you to monitor changes in land use and land cover.
Highlights include the addition of new high-resolution imagery as well as site improvements that make it easier to edit projects, onboard new users, and label key features within plots.
CEO has made it easier to create and edit projects. The site’s project wizard guides administrators through the project creation process, with text explaining every step and interactive preview panes for key steps, such as survey question creation.
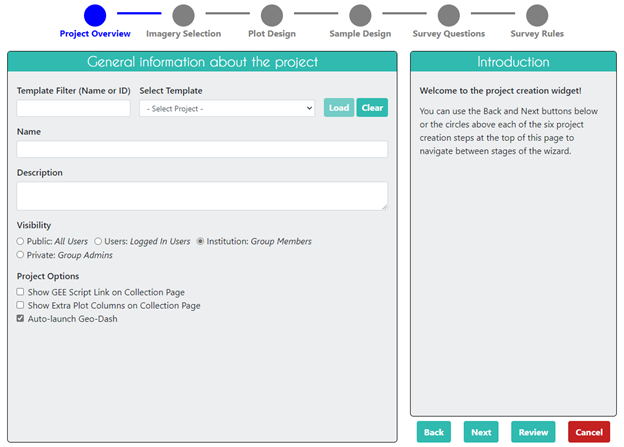
As part of the project wizard, CEO has added the option for project administrators to draft, test, and edit their projects. Previously, CEO administrators needed to create separate projects for each testing iteration as well as for official data collection.
Now, administrators can create a project just once, and then edit as needed. After they first create a project, they can conduct an internal testing phase with other administrators within the institution. Administrators now have the ability to edit any piece of the project while in draft mode, so they can fine tune their project to meet their objectives. Then, when they are satisfied, they can publish the project—i.e., make it live—so a broader community of users can contribute to the data collection effort.
For example, suppose that, during the testing phase, the administrators discover that the sampling design is insufficient and more sampling points are needed within each plot. They can easily change the number of sampling points for the draft project. In earlier versions of CEO, such changes would have required scrapping the project and starting over. Now, they can simply edit the project.
It is very important to remember that once a project is published, it can no longer be edited, and any data collected before publication is deleted.
High-resolution basemaps from Planet are now available as public imagery through CEO. The basemaps, with a resolution of less than 5 meters per pixel, cover more than 64 countries in the tropics and are available in both visible and infrared light. The images are updated roughly every month, providing access to a consistent, date-stamped data source.
The Planet imagery complements imagery from Mapbox already available in CEO. Mapbox provides cloud-free basemaps by compiling images from a variety of sources and dates.
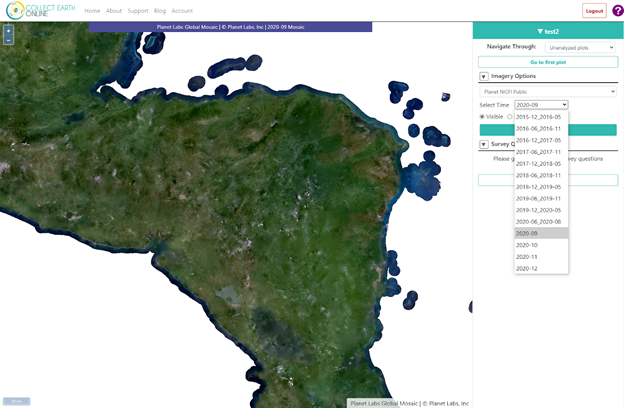
By contrast, all of the Planet images are time-stamped, allowing users to access basemaps from a particular moment in time. Unlike the mosaics from Mapbox, these will be subject to cloud cover; however, the user can be confident of the timing of landscape conditions observed in the images. The imagery is available in monthly increments starting in October 2020, and in six-month increments back to December 2015. That means if a patch of forest was cleared last week, that clearing should be visible in the following month’s basemap from Planet.
“If you’re looking for land cover change that happened in the past year, or even the past month, then the Planet data is a fantastic option,”
says Karis Tenneson, Director of the Environmental Mapping Domain within Spatial Informatics Group.
Access to the basemaps is courtesy of the government of Norway, which contracted with Kongsberg Satellite Services (KSAT), Planet, and Airbus to make this imagery available. The project is part of Norway’s International Climate & Forests Initiative (NICFI), an effort to stop deforestation and save the world’s tropical forests while offering sustainable pathways to economic development. To read more about the program, click here.
You can add the Planet NICFI data to any project in CEO. For new projects, simply select “Planet NICFI Public” when selecting imagery. For existing projects, navigate to your institution’s project dashboard and click on the “Edit” button next to the project. Click “Edit Project,” then click on the “Imagery Selection” pane of the project wizard. Select “Planet NICFI Public,” then click on “Review,” and then finally click “Update Project.”
Are you responsible for getting people up and running in CEO? We’ve introduced new product tour pop-ups to help with the onboarding process.
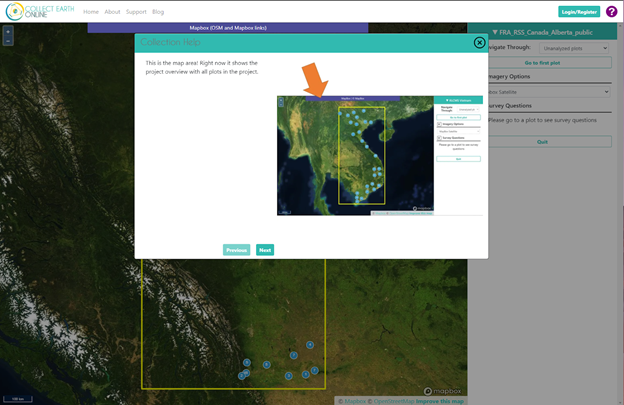
These pop-ups can be accessed by clicking on the purple question mark in the upper right corner of the window. The pop-ups are available on three pages to provide a quick orientation to help users get started: the home page, the data collection interface, and the project creation interface.
These pop-ups can also be shown in different languages. If you are interested in providing a translation to us, we can add it for your users! Please contact us at support@collect.earth.
For a deeper dive into the site’s functionality, users can still access the CEO manuals—available in English, Spanish, Portuguese, and French—through the support page.
Another feature, proactive sampling, provides greater flexibility in data collection, allowing users to draw features within a plot by creating points, lines, and polygons. Administrators can enable this functionality simply by clicking a box in the project creation wizard.
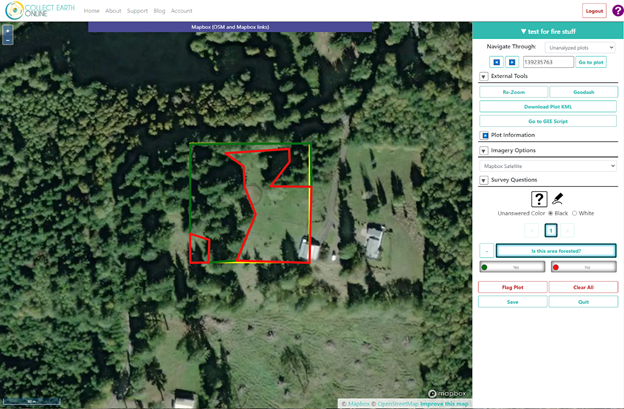
With this feature enabled, users will be prompted to draw points, lines, and polygons and then answer questions about each of the shapes drawn. Among other things, this approach can be valuable for projects looking for explicit spatial boundaries for specific features (e.g., agricultural fields) and projects looking for rare land classes. Tenneson says”
This offers a great way to get users to provide more detailed spatial data. It allows you to label land cover in a far more granular way.
The USAID Greening Prey Lang project in Cambodia is using this feature to verify illegal deforestation alerts. Project staff members identify the deforested area with the proactive sampling tool before forwarding alert information to provincial law enforcement officers for action.
Jeff Silverman, Senior Manager for Sustainable Finance with the Greening Prey Lang project, says:
In addition to providing the location, having the polygon footprint of newly deforested areas provides important context to rangers going to the location. It creates a useful record for ongoing monitoring of changes in that area, and also provides accurate quantitative records of forest area loss.
These fantastic feature improvements are thanks to the generous support of FAO, SCO, and SilvaCarbon. Thanks also to technology partners Norway’s International Climate & Forests Initiative for funding open high-resolution data availability, Planet for providing high-resolution imagery, and the Google Earth Engine team for creating a platform for Earth Science data and analysis.
Watch for more new releases coming in spring 2021! As always, user feedback is invaluable to the continued improvement of CEO. If you have an idea, let us know at support@collect.earth!