CEO Collect Earth Online

Spring 2021 Updates: OpenStreetMap, XYZ, and More

Spring 2021 Updates: OpenStreetMap, XYZ, and More

Collect Earth Online is excited to share news of our Spring 2021 updates, which include additional quality control tools, new imagery sources, and a broad range of backend improvements.

🎊 Additional Quality Control Tools

With this update, three new tools join CEO’s quality control toolbox. This is the first phase of many quality control improvements to come to CEO.

First, we’ve enabled administrators to navigate to plots with data collected by users. Administrators can now select “All analyzed plots” under the “Navigate Through” dropdown menu.

This means that administrators can randomly select plots and easily navigate to them to perform quality control by checking the answers provided by users. Administrators can also change answers from users, an on-the-fly method of ensuring the quality of the data.

Second, there is now an option to collect data about user confidence via a slider (as indicated by the arrow in the screenshot below).

If you want users to be able to tell you how certain they are of their answers to the survey questions, the confidence slider will allow them to assign a value 1–100, where 100 represents complete confidence in their answers. The value assigned applies to the entire plot.

Administrators can now collect information about users’ confidence about their answers for each plot.

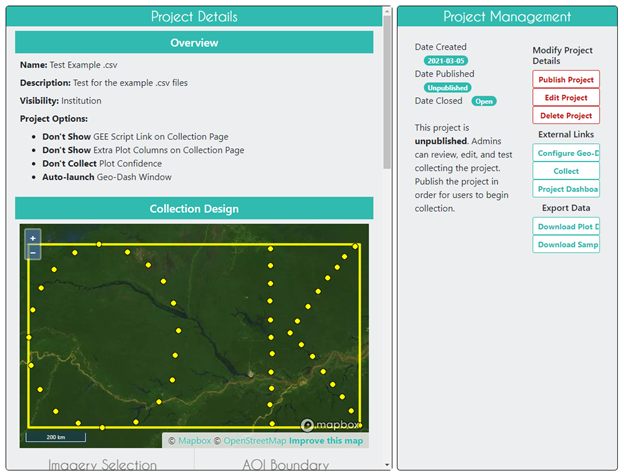
To enable this option, check “Collect Plot Confidence on Collection Page” in Project Options. These confidence values will be included in your plot and sample CSV downloads.

Third, when collecting data, users can now add a reason for flagging a plot. This might include imagery quality issues like “cloud cover” or uncertainty issues like “mixed pixel.”

Administrators do not need to enable this feature, as it is on by default. The user-entered reasons will show up as a column in the downloaded data.

Together, these additions provide important tools that administrators can use to ensure high quality data for their projects. CEO is committed to empowering administrators with appropriate quality control tools. Look for even more such tools in the next update.

The quality control tools are already playing a vital role in a project in the Republic of Congo (ROC). Teams from SilvaCarbon, FAO, and the Coalition for Rainforest Nations are working with the Republic of the Congo Technical Working Groups (TWG) to compile the GHG emissions and removals for the Energy, Agriculture, Forestry and Other Land Use, Industrial Processes, and Waste sectors to prepare ROC’s Third National Communication (TNC).

Their project is exciting as it expands previous work in the scope of REDD+ monitoring, reporting, and verification (MRV). While the team’s existing work focused on forest land, there is a growing interest and commitment to explicitly represent other land categories and changes. The team adopted a methodology to monitor the full spectrum of land use and cover changes—including cropland, grasslands, and wetlands—through interpretation of time series images in CEO. The methodology is intended to be used in conjunction with emission factors related to the disturbance activities, providing estimates of emissions.

As part of this work, the team has assigned an administrator to navigate to a subset of randomly selected plots to perform daily quality control checks.

Carine Saturnine Milandou, with Republic of Congo CNIAF says,

We can ensure that we have enough credible information to guarantee an optimal greenhouse gas inventory that covers all land use categories. The use of this methodology based on the revision in CEO, of randomly selected plots, promises a successful outcome of the Third National Communication.

📋 Survey Rules

To assist users, CEO has added a “Rule” icon to any survey that contains a rule.

If you hover over the icon, a pop-up will appear listing the rules that have to be followed. To take an obvious example, a rule might specify that the question “What percent is forested?” requires a numeric value between 0 and 100. Hovering over the icon will trigger a pop-up with text spelling out the rule.

Hovering over the new rule icon reveals a pop-up identifying the rules for a question.

Warning messages for violating rules while collecting are now more specific, as shown in this screenshot:

Users will see a descriptive error when they violate a survey rule.

In addition, the CEO wizard now makes it easier for administrators to test rules when creating a project. When CEO renders survey questions, it will now also render the rules that have been set up. This feature allows you to see both questions and rules and test how they work, allowing you to ensure that the rules are working as intended before the project is published and data collection begins.

The survey rule creation screen will show a preview of the rule icon.

Finally, users may notice a couple of minor fixes to survey rules: the tool tips for rules on the project creation wizard have been styled to be cleaner, and the logic for adding new rules has been overhauled to fix reported bugs.

🗺 OpenStreetMap

CEO users now have access to OpenStreetMap, an open-source project maintained by a global community of users who contribute mapping information.

Rather than satellite imagery, the interface is in the style of Google Maps, with roads and other features identified against a neutral background.

CEO administrators can now add OpenStreetMap as a basemap option for data collectors. 
CEO administrators can now add OpenStreetMap as a basemap option for data collectors.

Karis Tenneson, Director of the Environmental Mapping Domain within Spatial Informatics Group says,

Because it has street names, OpenStreetMap can be useful for orienting users. Administrators can add this imagery to help users situate themselves in the landscape.

OpenStreetMap can be used as a basemap for CEO’s GeoDash feature, which allows users to set up custom widgets. A widget could include, for example, an OpenStreetMap basemap overlaid with satellite imagery. Leveraging the transparency features in GeoDash keeps the street names visible, thereby helping users read the satellite imagery more easily.

CEO provides OpenStreetMap’s Standard Tile Layer, its default tile layer option.

🚀 XYZ Tiles

OpenStreetMaps uses the XYZ standard. If you’re interested in adding any other XYZ tile server, that option is also now available in CEO.

Services that can be added include any of the adaptations of OpenStreetMap, Yandex, Bing, and Google maps, as well as any other service using XYZ tile servers.

This example shows how to add Yandex imagery using the new XYZ imagery option in CEO.

🔨 Beta testing process

This update is also our second update using our trusted tester process to confirm that new launches do not disrupt data collection on active projects. For the Fall 2020 update, we piloted a process of giving experienced CEO users an early look at our planned updates and inviting them to test upcoming updates with their existing workflows. Using user feedback, we were able to address multiple potential issues prior to release. This approach worked well, and so we have tested the Spring 2021 release in the same way. If you’re an experienced CEO user and are interested in participating in this program, please email support@collect.earth.

📣 Data Retention Policy

We would also like to highlight CEO’s data retention policy. This policy helps CEO maintain a high-quality user experience and facilitate faster plot navigation. You can now access this policy anytime by visiting: https://collect.earth/terms-of-service.

Collect Earth Online makes no guarantee of retention of data. Please ensure that you keep local copies of any information used to create a project and any results downloaded.

Specific clean-up activities are described below:

  • Projects will be removed when the survey has not been collected in a certain amount of time.
        • The project has been inactive for 180 days, and the phase is not published, and the number of plots collected is under 5%
        • The project has been inactive for 270 days, and the number of plots collected is under 5%
        • The project has been inactive for 730 days, and the number of plots collected is under 20%
      • Institutions will be removed when there contain no Projects
        • Institutions with no projects, and was created over 180 days ago

Administrator discretion can be used at any point for projects or institutions that are created with malformed or test data.

🎀Other updates

Other CEO updates for spring 2021 include:

  • Institutional logos are now being stored in the database. If your logo does not appear on your institution page, please upload it again.
  • Users should see faster load times on almost all pages. Plot navigation and CSV downloads will have the most noticeable performance increase.
    • The home page project list loads twice as fast.
    • The institution page project list loads three times as fast.
    • Plot navigation is five times as fast.
    • Downloading CSV output is twice as fast.
  • When adding new imagery:
    • The validation of JSON has improved to correct some mistakes.
    • The validation of WMS is more specific, so that users will get more useful feedback.
    • Suggested minimum and maximum values are shown for Sentinel.
  • Imagery controls on the collection page:
    • UI stylings have been updated to prevent mis-rendering (such as imagery selection rendering on top of survey questions).
    • Users must now click “Update Imagery” to load imagery with different parameters; this prevents over-requesting from the remote server, which can lead to slowness.
    • For layers such as Planet, a message now appears at the project overview explaining that users must go to a plot before the map will show.
    • GeoDash:
    • Code restructuring eliminates extra calls to the server.
    • The plot ID is now shown in the navigation bar.
    • When creating a project, example shape and CSV files are now available for download. The example files should spell “OK” (as in the screenshot below) when they are used to create a project.
    • User’s analysis duration will be shown in the CSV output for both flagged plots and plots that were answered.
    • Institutions:
      • Administrators are now blocked from removing the last administrator in an institution.
      • Administrators will get an email when a user makes a request to become a member.
      • The loading models have been added, which should prevent an administrator from adding a new user to an institution multiple times before receiving a response from the server.
      • An issue involving long load times for project statistics has been addressed, so the load time will no longer interfere with adding or updating users.
Example shape and CSV files
Example shape and CSV files are now available for download.
  • User’s analysis duration will be shown in the CSV output for both flagged plots and plots that were answered.
  • Institutions:
    • Administrators are now blocked from removing the last administrator in an institution.
    • Administrators will get an email when a user makes a request to become a member.
    • The loading models have been added, which should prevent an administrator from adding a new user to an institution multiple times before receiving a response from the server.
    • An issue involving long load times for project statistics has been addressed, so the load time will no longer interfere with adding or updating users.


Our thanks to ongoing funders FAO, NASA SERVIR, and SilvaCarbon. Thanks also to technology partners Norway’s International Climate & Forests Initiative for funding open high-resolution data availability, Planet for providing high-resolution imagery, and the Google Earth Engine team for creating a platform for Earth Science data and analysis.

Collect Earth Online is working constantly to improve the user experience, and your feedback is invaluable. If you have an idea, please let us know by writing to support@collect.earth. Thank you!