CEO Collect Earth Online

Using CEO to Estimate the Area of Crop Expansion into the Forests of Southeast Asia

Using CEO to Estimate the Area of Crop Expansion into the Forests of Southeast Asia

A new USAID-funded study used Collect Earth Online (CEO) to devise a novel solution to the thorny problem of estimating the area devoted to specific crops, as well as the area of forest loss. The research should help improve estimates of carbon storage and loss in developing countries.

This technique will prove useful to researchers around the world, especially now that monthly high-resolution images are available from Planet, thanks to the financial support of Norway’s International Climate and Forest Initiative (NICFI). When this study was conducted, image scarcity was sometimes a roadblock, but the newly available Planet NICFI imagery—and its integration into CEO—addresses this challenge.

The study, “Commodity-Driven Forest Loss: A Study of Southeast Asia,” is available for free download. It quantifies how many hectares of natural forests were converted to other land uses in the region from 2000–2015, and what types of crops have replaced natural forest. The report explored tradeoffs between agricultural production and forest conservation, and made recommendations for practices that can support sustainable development.

📈Sustainable development information needs

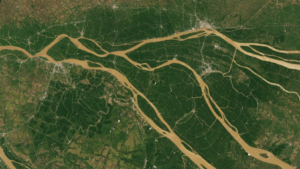
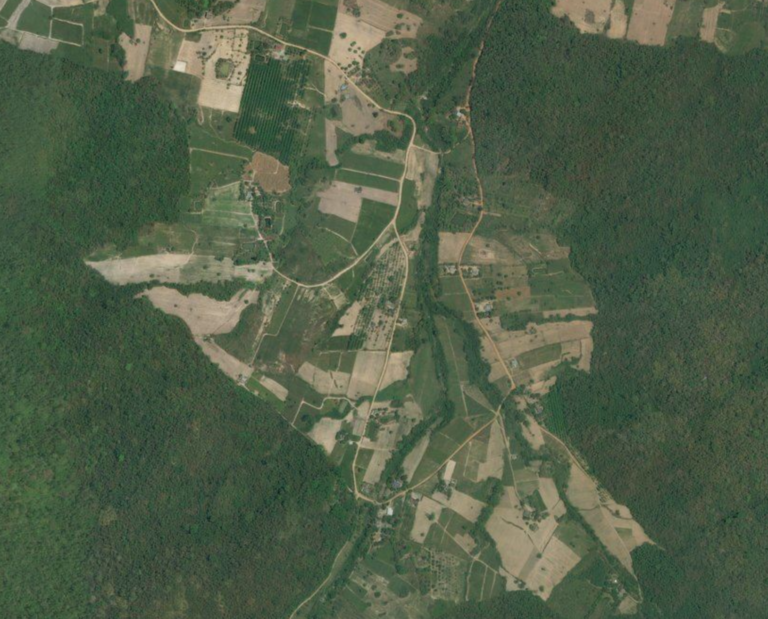
Southeast Asia’s economic growth has in part been driven by increased agricultural production. To promote sustainable economic and low-emission development, countries need good-quality data to guide land use decision-makers, the private sector, and development partners.

Countries in Southeast Asia face the challenge of exploring tradeoffs between agricultural production and forest conservation. One of the driving forces behind forest conservation is reducing contributions to greenhouse gas (GHG) emissions. Cutting down forests contributes to GHG emissions. Nationally determined contributions (NDCs) are a critical component of global GHG reporting processes. In addition to being mandated under the UNFCCC, NDCs allow countries to quantify their carbon budgets—i.e., the GHGs they are emitting versus the carbon they are storing in forests and other carbon “sinks.” Such accounting and reporting also allows countries to receive climate-based finance for their conservation efforts.

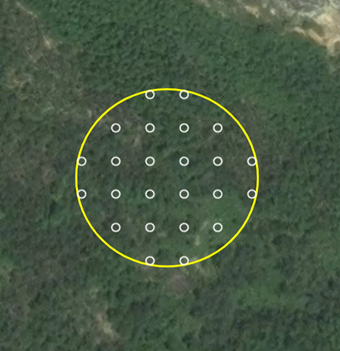
Although the use of remote sensing-based methodologies to measure and report impacts of forest loss has been implemented by most countries, assessing the impacts of smart agriculture practices on GHG emissions and sinks has proven more challenging. This challenge is particularly complex in the land use sector, where scientists must quantify the type, quantity, and geographic extent of above- and below-ground plant matter, also known as biomass.

Historically, obtaining such detailed information on plant or crop types required either ground-based surveys (which can be extremely difficult, especially in rough terrain) or access to high-quality satellite imagery, which is often either unavailable or unaffordable. This creates roadblocks to the crucial effort to estimate emissions caused by land cover change and to create independent emissions-monitoring systems.

Delta with crop fields in Viet Nam. Imagery courtesy Bing.
Delta with crop fields in Vietnam. Imagery courtesy Bing.

🌄A new way to estimate crop expansion

The USAID-funded study—which focused on Cambodia, Lao PDR, Indonesia, Myanmar, Thailand, Philippines, and Vietnam—devised a novel solution to this problem that relied on CEO, and in particular on the high-resolution satellite data freely available through the platform.

Researchers used point-sampling—a statistical technique for estimating vegetative cover in a landscape—to quantify the total area for particular land cover types in the seven countries.

First, the researchers used existing, freely-available maps to determine where forest loss was likely to have occurred. Based on these maps, they created three strata. The first stratum included areas of likely deforestation of intact forest patches, while the second stratum included likely deforestation of fragmented forest. The third stratum included all areas without likely deforestation. The researchers then generated random samples within each stratum for each of the seven countries.

One of the plots (yellow) with samples (white) that local land use cover experts examined in CEO.

Next, researchers used CEO’s ability to upload user-generated plots via CSV or shapefile to create custom CEO projects. A team of local land use cover experts examined these plots using imagery available in CEO for the years 2000 and 2015. They used Landsat imagery for 2000, while for 2015 they used available high-resolution imagery. One new option is Planet imagery, which is available in CEO thanks to funding from NICFI. In addition, the team used CEO’s Geo-Dash to review time series of Landsat-derived indices, including normalized difference vegetation index (NDVI) and short-wave infrared (SWIR) for the years 1990–2000.

Using CEO and the available imagery, the researchers classified whether the area was forested. For agricultural land, they determined the particular crops grown (such as oil palm or herbaceous crops) and distinguished between monoculture and agroforestry systems. The team assigned a baseline land use label in 2000 and a current land use label for post-2015.

CEO was used to ensure data quality throughout the project. Before data collection, all team members completed a project with the same 200 plots in order to improve within-team agreement. During data collection, the team leveraged CEO’s built-in rule set functionality to constrain which label combinations were allowed.

After land use values were assigned to each plot, the researchers were able to estimate the area for each crop. The team used a clustered sample design estimator to create these estimates. This approach is similar to the one available through CEO’s sister tool, SEPAL. If you are interested in this approach, there is documentation available through SEPAL as well as through OpenMRV.

The researchers then estimated the carbon gains or losses for each country between 2000 and 2015. They did so by taking the estimated area of each land cover type and multiplying it by what is known as a “Tier II carbon stock factor.” Tier II factors are specific to land cover types within ecozones and therefore offer more precise estimates than the globally based Tier I factors. The calculations produced estimates of carbon gains or losses for each country between 2000 and 2015.

This method required little to no advanced technical expertise, modeling skills, or statistical programming, and was based on freely available data that was easy to access, even over patchy internet connections. The results proved to be comparable to those from more detailed, expensive, and technical studies. The method therefore could be broadly useful to development practitioners in countries or regions that have limited technical and financial resources.

🌱Surprising results to help guide policy

The methods in this study are expected to support technical agencies from various countries to improve the quality and cost-effectiveness of land cover change mapping. Equally important are the study results, which can inform policy formulation and help governments in Southeast Asia meet their NDC targets.

Crops surrounded by forests in Thailand. Imagery courtesy Bing.

The study estimated that 15.8 million hectares of forest were lost between 2000 and 2015, of which 9.4 million hectares now support various types of crops. This result was not unexpected.

More surprisingly, the study results overturned some common assumptions about forest degradation in the region:

  • Conventional wisdom holds that oil palm is the major driver of deforestation in the region. The study showed that this is true only in Indonesia. In other countries deforestation was caused primarily by rubber and pulpwood (Thailand) or herbaceous crops such as cereals and cassava (Cambodia, Lao PDR, Myanmar, and the Philippines).
  • The study also determined that swidden (or shifting) agriculture—relied upon by many rural communities in upland areas—is not as destructive as it is often portrayed. Many of the fallows, or out-of-rotation areas, of this type of agriculture contained more biomass (and likely more biodiversity) than commodity crop agricultural systems.

The team estimated that emissions from forest loss in Southeast Asia amounted to a staggering 1.5 billion metric tonnes of CO2 equivalent between 2000 and 2015. The vast majority of these emissions (1.1 billion metric tonnes) came from the removal of tropical rainforest, and an additional 132 million metric tonnes came from loss of tropical rainforest on peatlands. It should be noted that these results quantified only above-ground biomass. Below-ground biomass and emissions from soil degradation would make these totals substantially larger.

The study points the way toward smarter sustainable development in the future. The findings should help USAID—as well as other funding organizations—prioritize investments that improve livelihoods for farmers while also promoting climate mitigation, biodiversity conservation, and better management of natural resources.

CEO would like to thank its ongoing funders FAONASA–USAID SERVIR, and SilvaCarbon, a US government program. Thanks also to CEO’s technology partners: Norway’s International Climate & Forests Initiative for funding open high-resolution data availability; Planet for providing high-resolution imagery; and the Google Earth Engine team for creating a platform for Earth science data and analysis.

Collect Earth Online is working constantly to improve the user experience, and your feedback is invaluable. If you have ideas to share, please write to support@collect.earth.

Thank you!